

BELLABEAT CASE STUDY
SCENARIO
As a junior data analyst, I'm recently working for a company named Bellabeat. Bellabeat is an high-tech manufacturer of health-focused smart devices for women founded in 2013 by Urška Sršen & Sando Mur. Here are some examples of bellabeat products :
Bellabeat app : The Bellabeat app provides users with health data related to their activity, sleep, stress,menstrual cycle, and mindfulness habits. This data can help users better understand their current habits and make healthy decisions. The Bellabeat app connects to their line of sma wellness products.
Leaf Bellabeat’s classic wellness tracker can be worn as a bracelet, necklace, or clip. The Leaf tracker connects to the Bellabeat app to track activity, sleep, and stress.
Time: This wellness watch combines the timeless look of a classic timepiece with sma technology to track user activity, sleep, and stress. The Time watch connects to the Bellabeat app to provide you with insights into your daily wellness.
Spring: This is a water bottle that tracks daily water intake using sma technology to ensure that you are appropriately hydrated throughout the day. The Spring bole connects to the Bellabeat app to track your hydration levels.
Bellabeat membershipBellabeat also offers a subscription-based membership program for users. Membership gives users 24/7 access to fully personalized guidance on nutrition, activity, sleep, health and beauty, and mindfulness based on their lifestyle and goals.
BUSINESS TASK
To better understand their customer needs and the smart devices market, Urška Sršen asked me to conduct an analysis. We want to identify the trends in smart device usage, see how these trends can apply to Bellabeat customers and help Bellabeat build a data driven marketing strategy. I'll have a week to conduct the analysis and share it with the Bella beat marketing analytics team. But I'll force myself to do it in 3 days without having to lower the quality of my study just to see how I would react to tight deadlines.
ASK
To define what kind of trend we want to identify in smart devices usage, we will try to answer a few questions :
Do users always wear their device ? and if not when do they remove it ? What is the percentage of users that always wear their device ?
What motivates users to wear smart devices ? Sport ? Biometrics tracking ? Are there users that do sport without going into the app ?
What are the days of the week in which users use the app the most ?
What are the Sleep, Weight, Intensities of activities and calories burning trends among users
What is the percentage of users that use Weight monitoring and why ?
What are the customers "types”
Id love to ask more question to Urška on the data she provided me to clarify some points. In a real life situation I would reach out to my supervisors to be sure I'm heading the good way with my analysis.
GET THE DATA READY
In the case study, a Kaggle Dataset is provided containing data from 2016 on 30 random Fitbit Users. First, we will perform The ROCC test to see if we can trust the dataset :
Dataset is RELIABLE : LOW In this case the dataset is not really representative of the population, 30 people can't really represent all the customers of a global company like bellabeat.
Dataset is ORIGINAL : MEDIUM The dataset is provided by MOBIUS which seems to be a trustworthy source on Kaggle as he is a steady and respected contributor (Lots of medals and considered a Dataset Master). But it is still third party data.
Dataset is COMPLETE & UNDERSTANDABLE : LOW Dataset misses a lot of information. Lots of information is missing, in the “Daily_Activity” there are missing records for a lot of customers. We would also need gender info as Bellabeat is a women-oriented company. Data is not well explained as there is no metadata. We do our best to make assumptions on data.
Dataset is CURRENT : LOW Dataset is not current as it is 10 years old now, smart devices users might have changed their habits.
Dataset CITED : LOW Dataset comes from a distributed survey via Amazon Mechanical Turk, so yes it is cited but not from a very reliable source
RELIABILITY issue : The dataset provided is already huge, there are approximately 2 millions observations by table and there are 7 tables by period for 2 periods of time. For technical reasons it will be difficult to deal with a bigger dataset on my personal laptop . As it is a Case study we will perform the analysis on this sample size but the recommendations i’ll do couldn't really apply in a real life scenario.
Source is not really UNDERSTANDABLE: I'll try to make assumptions on the data.
Source is OUTDATED : As it is a Case study we will still perform the analysis on this outdated data but the recommendations i’ll do couldn't really apply in a real life scenario.
Fitness data about users seems to be really hard to find as there might be some confidentiality issues in sharing it publicly. I searched BigQuery public datasets and fitabase to find better data and couldn't find it for free. As this case study is provided by google (a trustworthy source) and that i can't just “give up”, i'll take this case study as a challenge to make sense out of this dataset by making assumptions on the data. It can also be seen as an opportunity to do an analysis on Data inconsistency and explain why this dataset is a really bad one which should never be used to make data driven decisions.
The Kaggle dataset is organized in 2 folders containing the same type of tables for 2 months in 2016 (march and april).
We have 3 types of data :
The data that is continuously recorded by the device, there is data as long as the user is wearing the device. We have different types of metrics (Calories, Sleep, MET, Intensity, Steps)
There are different files for the same metrics (minutes, hour and day) . I'll import just the metrics by minutes for Calories Sleep and Intensity.
- Calories : Calories burnt by minute. (continuous entire number)
- Intensity : Intensity of the activity made by the user by minute. (0,1,2,3)
- Sleep : There is a record if the user is asleep (1,2 or 3 for the recovering quality of sleep)
We have the same tables for April and March
The user logs into the app to record activity himself, he asks for a report on this day or he just opens the app which automatically generates a record for the day. There is just one table by month called DailyActivity (by day).
-
The user enters the data himself on the app. Also one table by month called WeightLogInfo. (We will discuss this point later on the analysis part)
I came up with this classification because we have way more data in the table "Continuous_record" than “DailyActivity”. WeightLogInfo is the one with the least data (maybe because it requires more effort from the user). A table called SleepDay is also available only for the month of april. We use the table to know how many people track their sleep on the total population.
DATA CHOICE EXPLANATION
- Calories : if there is a record the user was wearing the watch.
- Intensity : To see if there is some sport activity untracked by the app.
- Sleep : there is data only if the user is asleep so we can track sleeping habits of users and maybe link it to other habits they have.
PROCESS
We will use BigQuery and Tableau to perform this analysis.
As I was trying to import data to BigQuery I noticed there was some invalid format in the dates. I tried to automatise the cleaning on Google Sheets but couldn't manage to switch AM/PM hours to 24h based timestamp. I tried to clean it on RStudio and finally succeeded in setting the appropriate timestamp for my data. Here is the process :
 ## Charger les bibliothèques nécessaires
   library(dplyr)
   library(lubridate)

## Charger les données
   data <- read.csv("/Users/msayn47painter/Desktop/CASE_STUDY_Bellabeat
                     /Bellabeat_data/April_data
                     /Fitabase Data 4.12.16-5.12.16/weightLogInfo_merged.csv")

## Vérifier que la colonne est bien en texte
    data$Date <- as.character(data$Date)

## Convertir les dates en format Date-Time avec heure en 24h
    data$Date <- mdy_hms(data$Date)

## Forcer l'affichage des heures, même pour minuit (00:00:00)
    data$Date <- strftime(data$Date, format="%Y-%m-%d %H:%M:%S")

## Sauvegarder le fichier nettoyé en CSV
    write.csv(data, "/Users/msayn47painter/Desktop/CASE_STUDY_Bellabeat/Bellabeat_data/April_data
                     /CleanedData_april/WeightLogInfo_april.csv", row.names = FALSE, quote = FALSE)
I did the same operation for all tables.
Now we have to organize the data to better understand it and clean it. First I'll group these 3 tables (Sleep, Intensity and Calories) in one with the following columns
As it is more complete, We'll use the data by minutes tables and use it to create a table by hours: Continuous_record (minutes) and Continuous_hours
-- march

            CREATE TABLE `nimble-mode-447321-p1.bellabeat.Continuous_record_march` AS
            WITH
                calories AS (
                    SELECT
                        ActivityMinute AS date,
                        Calories,
                        id  -- Ajout de la colonne id de Calories_march
                    FROM `nimble-mode-447321-p1.bellabeat.Calories_march`
                ),
                sleep AS (
                    SELECT
                        date,
                        Value
                    FROM `nimble-mode-447321-p1.bellabeat.Sleep_march`
                ),
                intensities AS (
                    SELECT
                        ActivityMinute AS date,
                        Intensity
                    FROM `nimble-mode-447321-p1.bellabeat.Intensities_march`
                )
            SELECT
                c.date AS ActivityMinute,
                c.id,
                MAX(c.Calories) AS Calories,
                COALESCE(MAX(s.Value), 0) AS Sleep_Value,
                MAX(i.Intensity) AS Intensity
            FROM calories c
            LEFT JOIN sleep s ON c.date = s.date
            LEFT JOIN intensities i ON c.date = i.date
            GROUP BY c.date, c.id

-- april

            CREATE TABLE `nimble-mode-447321-p1.bellabeat.Continuous_record_april` AS
            WITH
                calories AS (
                    SELECT
                        ActivityMinute AS date,
                        Calories,
                        id
                    FROM `nimble-mode-447321-p1.bellabeat.Calories_april`
                ),
                sleep AS (
                    SELECT
                        date,
                        Value
                    FROM `nimble-mode-447321-p1.bellabeat.Sleep_april`
                ),
                intensities AS (
                    SELECT
                        ActivityMinute AS date,
                        Intensity
                    FROM `nimble-mode-447321-p1.bellabeat.Intensities_april`
                )
            SELECT
                c.date AS ActivityMinute,
                c.id,
                MAX(c.Calories) AS Calories,
                COALESCE(MAX(s.Value), 0) AS Sleep_Value,
                MAX(i.Intensity) AS Intensity
            FROM calories c
            LEFT JOIN sleep s ON c.date = s.date
            LEFT JOIN intensities i ON c.date = i.date
            GROUP BY c.date, c.id
We will also use the table DailyActivity (daily Data)
And the table WeighLogInfo (Daily Data) :
And Finally the table SleepDay :
DATA CLEANING
DATA MERGING :
First it is important to merge the data from both monthes to have all the data in the same table
-- Continuous record
INSERT INTO `nimble-mode-447321-p1.bellabeat.Continuous_record`
(id, ActivityMinute, Calories, Sleep_Value, Intensity)
SELECT id, ActivityMinute, Calories, Sleep_Value, Intensity
FROM `nimble-mode-447321-p1.bellabeat.Continuous_record_april`
UNION ALL
SELECT id, ActivityMinute, Calories, Sleep_Value, Intensity
FROM `nimble-mode-447321-p1.bellabeat.Continuous_record_march`;

-- Dailyactivity
CREATE TABLE `nimble-mode-447321-p1.bellabeat.Dailyactivity` AS
SELECT * FROM `nimble-mode-447321-p1.bellabeat.Dailyactivity_april`
UNION ALL
SELECT * FROM `nimble-mode-447321-p1.bellabeat.Dailyactivity_march`;

-- WeightLogInfo
CREATE TABLE `nimble-mode-447321-p1.bellabeat.WeightLogInfo` AS
SELECT * FROM `nimble-mode-447321-p1.bellabeat.WeightLogInfo_april`
UNION ALL
SELECT * FROM `nimble-mode-447321-p1.bellabeat.WeightLogInfo_march`;
Checking FORMATS :
SELECT column_name, data_type
FROM `nimble-mode-447321-p1.bellabeat.INFORMATION_SCHEMA.COLUMNS`
WHERE table_name = 'Continuous_record';

SELECT column_name, data_type
FROM `nimble-mode-447321-p1.bellabeat.INFORMATION_SCHEMA.COLUMNS`
WHERE table_name = 'DailyActivity';

SELECT column_name, data_type
FROM `nimble-mode-447321-p1.bellabeat.INFORMATION_SCHEMA.COLUMNS`
WHERE table_name = 'WeightLogInfo';
Continuous_record :
| Column | Format |
| ID | INT64 |
| Activity Minute | TIMESTAMP |
| Calories | FLOAT64 |
| Sleep_Value | INT64 |
| Intensity | INT64 |
DailyActivity :
| Column | Format |
| ID | INT64 |
| Activity Date | DATE |
| TotalSteps | INT64 |
| TotalDistance | FLOAT64 |
| LoggedActivitiesDistance | FLOAT64 |
| VeryActiveDistance | FLOAT64 |
| ModeratelyActiveDistance | FLOAT64 |
| LightActiveDistance | FLOAT64 |
| SedentaryActiveDistance | FLOAT64 |
| VeryActiveMinutes | INT64 |
| LoggedActivitiesDistance | INT64 |
| VeryActiveDistance | INT64 |
| FairlyActiveMinutes | INT64 |
| SedentaryMinutes | INT64 |
| SedentaryActiveDistance | INT64 |
| Calories | INT64 |
WeightLogInfo :
| Column | Format |
| ID | INT64 |
| Date | TIMESTAMP |
| WeightKg | FLOAT64 |
| WeightPounds | FLOAT64 |
| Fat | STRING |
| BMI | FLOAT64 |
| IsManualReport | BOOL |
| LogId | INT64 |
All the tables have a good data format (except "fat" which should be a Int64 but as the colum is empty we'll ignore this format).
Checking for NULL values :
SELECT
    COUNT(*) AS total_rows,
    COUNTIF(id IS NULL) AS missing_id,
    COUNTIF(ActivityMinute IS NULL) AS missing_activity_minute,
    COUNTIF(Calories IS NULL) AS missing_calories,
    COUNTIF(Sleep_Value IS NULL) AS missing_sleep_value,
    COUNTIF(Intensity IS NULL) AS missing_intensity
FROM `nimble-mode-447321-p1.bellabeat.Continuous_record`;

SELECT
    COUNT(*) AS total_lignes,
    COUNTIF(Id IS NULL) AS id_nulls,
    COUNTIF(ActivityHour IS NULL) AS activityhour_nulls,
    COUNTIF(Calories IS NULL) AS calories_nulls,
    COUNTIF(Sleep_Value IS NULL) AS sleep_value_nulls,
    COUNTIF(Intensity IS NULL) AS intensity_nulls
FROM `nimble-mode-447321-p1.bellabeat.Dailyactivity`;


SELECT
    COUNT(*) AS total_lignes,
    COUNTIF(Id IS NULL) AS id_nulls,
    COUNTIF(Date IS NULL) AS date_nulls,
    COUNTIF(WeightKg IS NULL) AS weightkg_nulls,
    COUNTIF(WeightPounds IS NULL) AS weightpounds_nulls,
    COUNTIF(Fat IS NULL) AS fat_nulls,
    COUNTIF(BMI IS NULL) AS bmi_nulls,
    COUNTIF(IsManualReport IS NULL) AS ismanualreport_nulls,
    COUNTIF(LogId IS NULL) AS logid_nulls
FROM `nimble-mode-447321-p1.bellabeat.WeightLogInfo`;
No NULL Values
Checking for ABNORMAL VALUES:
SELECT
    COUNT(*) AS total_lignes,
    COUNTIF(Calories < 0) AS calories_negatives,
    COUNTIF(Sleep_Value NOT IN (0,1,2,3)) AS sleep_value_invalides,
    COUNTIF(Intensity NOT IN (0,1,2,3)) AS intensity_invalides
FROM `nimble-mode-447321-p1.bellabeat.Continuous_record`;

SELECT
    COUNT(*) AS total_lignes,
    COUNTIF(Total_Calories < 0) AS calories_negatives,
    COUNTIF(Sleep_Value NOT IN (0,1,2,3)) AS sleep_value_invalides,
    COUNTIF(Intensity NOT IN (0,1,2,3)) AS intensity_invalides
FROM `nimble-mode-447321-p1.bellabeat.WeightLogInfo`;

SELECT
    COUNT(*) AS total_lignes,
    COUNTIF(TotalSteps < 0) AS total_steps_negatifs,
    COUNTIF(TrackerDistance < 0) AS tracker_distance_negatifs,
    COUNTIF(VeryActiveDistance < 0) AS very_active_distance_negatifs,
    COUNTIF(ModeratelyActiveDistance < 0) AS moderately_active_distance_negatifs,
    COUNTIF(LightActiveDistance < 0) AS light_active_distance_negatifs,
    COUNTIF(SedentaryActiveDistance < 0) AS sedentary_active_distance_negatifs,
    COUNTIF(VeryActiveMinutes < 0) AS very_active_minutes_negatifs,
    COUNTIF(FairlyActiveMinutes < 0) AS fairly_active_minutes_negatifs,
    COUNTIF(LightlyActiveMinutes < 0) AS lightly_active_minutes_negatifs,
    COUNTIF(SedentaryMinutes < 0) AS sedentary_minutes_negatifs,
    COUNTIF(Calories < 0) AS calories_negatives
FROM `nimble-mode-447321-p1.bellabeat.Dailyactivity`
There are some missing values in WeightLogInfo for "Fat", We ll keep everything and discuss it later.
Checking for DUPLICATES :
SELECT Id, ActivityMinute, COUNT(*) AS nb_occurences
    FROM `nimble-mode-447321-p1.bellabeat.Continuous_record`
    GROUP BY Id, ActivityMinute
    HAVING COUNT(*) > 1;

SELECT Date, id, COUNT(*) AS nb_occurences
    FROM `nimble-mode-447321-p1.bellabeat.WeightLogInfo`
    GROUP BY Date, id
    HAVING COUNT(*) > 1;

SELECT ActivityDate, id, COUNT(*) AS nb_occurences
    FROM `nimble-mode-447321-p1.bellabeat.Dailyactivity`
    GROUP BY ActivityDate, id
    HAVING COUNT(*) > 1;
Deleting DUPLICATES
REPLACE TABLE `nimble-mode-447321-p1.bellabeat.Continuous_record` AS
SELECT DISTINCT
    ActivityMinute,
    id,
    Calories,
    Sleep_Value,
    Intensity
FROM `nimble-mode-447321-p1.bellabeat.Continuous_record`
GROUP BY ActivityMinute, id, Calories, Sleep_Value, Intensity;

REPLACE TABLE `nimble-mode-447321-p1.bellabeat.DailyActivity` AS
SELECT DISTINCT
    Id,
    ActivityDate,
    TotalSteps,
    TrackerDistance,
    LoggedActivitiesDistance,
    VeryActiveDistance,
    ModeratelyActiveDistance,
    LightActiveDistance,
    SedentaryActiveDistance,
    VeryActiveMinutes,
    FairlyActiveMinutes,
    LightlyActiveMinutes,
    SedentaryMinutes,
    Calories
FROM `nimble-mode-447321-p1.bellabeat.DailyActivity`;

REPLACE TABLE `nimble-mode-447321-p1.bellabeat.WeightLogInfo` AS
SELECT DISTINCT
    Id,
    Date,
    WeightKg,
    WeightPounds,
    Fat,
    BMI,
    IsManualReport,
    LogId
FROM `nimble-mode-447321-p1.bellabeat.WeightLogInfo`;
Checking for DATA INCONSISTENCY :
        SELECT DISTINCT id
        FROM `nimble-mode-447321-p1.bellabeat.Continuous_record`

        SELECT DISTINCT id
        FROM `nimble-mode-447321-p1.bellabeat.Continuous_hours`

        SELECT DISTINCT id
        FROM `nimble-mode-447321-p1.bellabeat.Dailyactivity`

        SELECT DISTINCT id
        FROM `nimble-mode-447321-p1.bellabeat.WeightLogInfo`

        SELECT DISTINCT id
        FROM `nimble-mode-447321-p1.bellabeat.SleepDay`
Users :
35 users in Continuous_record 35 users in DailyActivity 24 users in SleepDay 13 users in WeightLogInfo
Generating MORE DATA :
We can now generate more data from our cleaned Tables. First we will create a table by hour from the table "Continuous_record" :
-- Continuous record en heures

CREATE TABLE `nimble-mode-447321-p1.bellabeat.Continuous_hours` AS
WITH aggregated_data AS (
    SELECT
        EXTRACT(DATE FROM ActivityMinute) AS Date,  -- Extraire la date
        EXTRACT(HOUR FROM ActivityMinute) AS Hour,  -- Extraire l'heure
        id,
        ROUND(Calories) AS Calories,  -- Arrondir les calories avant d'agréger
        Sleep_Value,
        Intensity
    FROM `nimble-mode-447321-p1.bellabeat.Continuous_record`
)
SELECT
    Date,
    Hour,
    id,
    SUM(Calories) AS Total_Calories,  -- Somme des calories pour chaque heure
    ROUND(AVG(Sleep_Value)) AS Sleep_Value,  -- Moyenne arrondie pour Sleep_Value
    ROUND(AVG(Intensity)) AS Intensity  -- Moyenne arrondie pour Intensity
FROM aggregated_data
GROUP BY
    Date, Hour, id
ORDER BY
    Date, Hour, id;
We'll call this table "Continuous_hours"
Then, We're will create new columns for our tables.
We can add A column to track the day of the week in "DailyActivity" :
REPLACE TABLE `nimble-mode-447321-p1.bellabeat.DailyActivity` AS
SELECT
    Id,
    ActivityDate,
    EXTRACT(DAYOFWEEK FROM ActivityDate) AS DayOfWeek,
    TotalSteps,
    TrackerDistance,
    LoggedActivities,
    VeryActiveDistance,
    ModeratelyActiveDistance,
    LightActiveDistance,
    SedentaryActiveDistance,
    VeryActiveMinutes,
    FairlyActiveMinutes,
    LightlyActiveMinutes,
    SedentaryMinutes,
    Calories
FROM
`nimble-mode-447321-p1.bellabeat.DailyActivity`;
We can add a new column to know the DayoftheWeek in "Continuous_hours".
REPLACE TABLE `nimble-mode-447321-p1.bellabeat.Continuous_hours` AS
SELECT
    Date,
    Hour,
    id,
    EXTRACT(DAYOFWEEK FROM Date) AS DayOfWeek,
    Total_Calories,
    Sleep_Value,
    Intensity
FROM
    `nimble-mode-447321-p1.bellabeat.Continuous_hours`
We will do the same for each table.
To have hints about users Inactivity we can create a table from "Continuous_hours".
WITH
ordered_data AS (
    SELECT
    id,
    Date,
    Hour,
    LAG(TIMESTAMP(CONCAT(CAST(Date AS STRING), ' ', CAST(Hour AS STRING), ':00:00')))
        OVER (PARTITION BY id ORDER BY Date, Hour) AS previous_activity,
    TIMESTAMP_DIFF(
        TIMESTAMP(CONCAT(CAST(Date AS STRING), ' ', CAST(Hour AS STRING), ':00:00')),
        LAG(TIMESTAMP(CONCAT(CAST(Date AS STRING), ' ', CAST(Hour AS STRING), ':00:00')))
        OVER (PARTITION BY id ORDER BY Date, Hour),
        HOUR
    ) AS time_diff
    FROM
    `nimble-mode-447321-p1.bellabeat.Continuous_hours`
),
inactivity_periods AS (
    SELECT
    id,
    previous_activity AS inactivity_start,
    TIMESTAMP(CONCAT(CAST(Date AS STRING), ' ', CAST(Hour AS STRING), ':00:00')) AS inactivity_end,
    TIMESTAMP_DIFF(
        TIMESTAMP(CONCAT(CAST(Date AS STRING), ' ', CAST(Hour AS STRING), ':00:00')),
        previous_activity, HOUR
    ) AS inactivity_duration
    FROM
    ordered_data
    WHERE
    time_diff > 1  -- Si l'écart entre les horaires est supérieur à 1 heure
)
SELECT
id,
inactivity_start,
inactivity_end,
inactivity_duration
FROM
inactivity_periods
ORDER BY
id, inactivity_start;
We'll call this table "Inactivity_continuous" it shows the periods of time that has more than 1 hour between 2 records.
We have a "Sedentary" timespan in "DailyActivity". We ll add a table to track time spent Sedentary but not in bed. The table "SleepDay" is only available for April so we will do an average for time in bed by user and substract it from "SedentaryTime".
WITH AverageTimeInBed AS (
    SELECT
        Id,
        AVG(TotalTimeInBed) AS AvgTimeInBed
    FROM
        nimble-mode-447321-p1.bellabeat.SleepDay
    GROUP BY
        Id
)

SELECT
    da.*, -- Sélectionne toutes les colonnes de DailyActivity
    COALESCE(atb.AvgTimeInBed, 0) AS AvgTimeInBed,
    da.SedentaryMinutes - COALESCE(atb.AvgTimeInBed, 0) AS Sedentary_notinbed
FROM
    nimble-mode-447321-p1.bellabeat.DailyActivity da
LEFT JOIN
    AverageTimeInBed atb
    ON da.Id = atb.Id;
Now we have to check for negtive values in this table.
SELECT *
FROM nimble-mode-447321-p1.bellabeat.DailySedentary_notinbed
WHERE Sedentary_notinbed < 0;
There are 61 records with negative values on a 1397 total records (4%). User 6117666160 combine 12 of these 61 records. Lets now check for time spent sedentary but not Asleep :
WITH AverageMinutesAsleep AS (
    SELECT
        Id,
        AVG(TotalMinutesAsleep) AS AvgMinutesAsleep
    FROM
        nimble-mode-447321-p1.bellabeat.SleepDay
    GROUP BY
        Id
)
SELECT
    da.*, -- Select all columns from DailyActivity
    COALESCE(ams.AvgMinutesAsleep, 0) AS AvgMinutesAsleep,
    da.SedentaryMinutes - COALESCE(ams.AvgMinutesAsleep, 0) AS Sedentary_notAsleep
FROM
    nimble-mode-447321-p1.bellabeat.DailyActivity da
LEFT JOIN
    AverageMinutesAsleep ams
    ON da.Id = ams.Id;
We still have 47 negative values in column "Sedentary_notAsleep" for this table. We ll try to give an explanation for that later.
One last table will be created to check for record "Hight Intensity Activity" in Continuous_hours without record in "DailyActivity" (to know what is the share of people who do sports without tracking it in the App
SELECT DISTINCT ch.Id, ch.Date
FROM nimble-mode-447321-p1.bellabeat.Continuous_hours ch
LEFT JOIN nimble-mode-447321-p1.bellabeat.DailyActivity da
    ON ch.Id = da.Id AND ch.Date = da.ActivityDate
WHERE ch.Intensity = 3
  AND da.Id IS NULL;
ANALYSIS
Now we can enter the most exciting part of this study : the Analysis. To better understand our data, we’ll use Tableau to make visualizations. Data patterns and trends will be more accessible that way. Unfortunately I'm using Tableau public and there is no way I can directly link Tableau to Big Query. I have no choice but to download the tables from BigQuery through Google Cloud Storage as CSV files and upload it to Tableau. For security reasons i wont put the Query containing my google bucket name publicly on this website.
INACTIVITY ANALYSIS
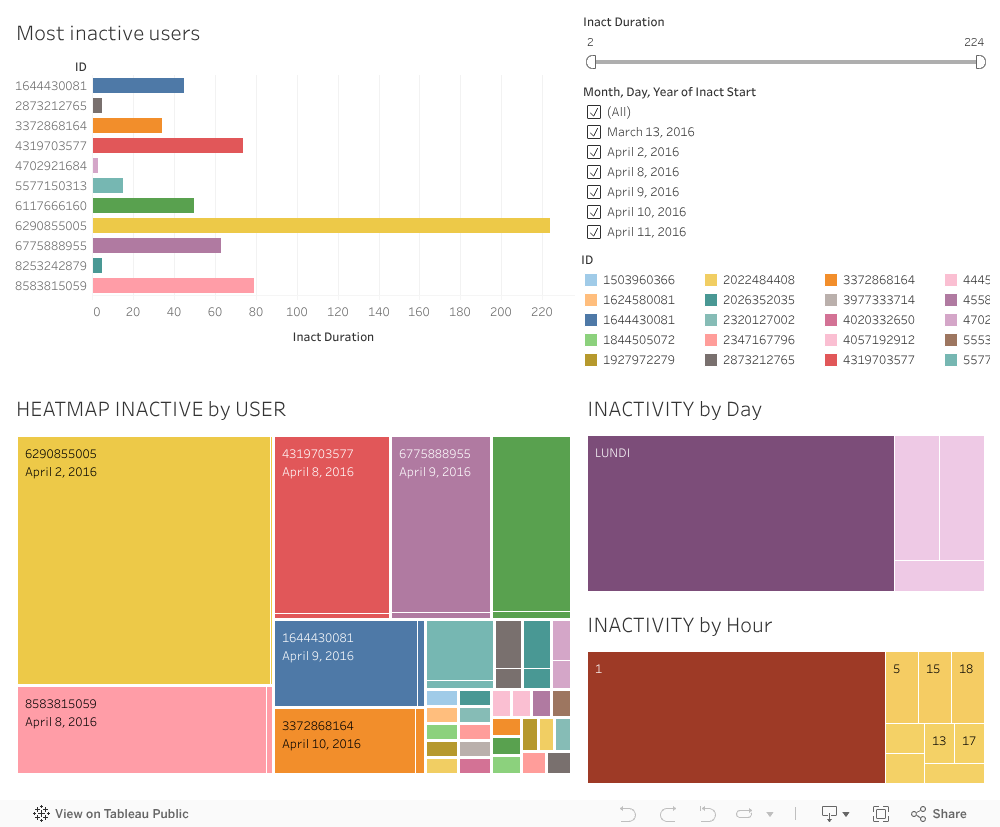
This Dashboard as been created from the table "Continuous_record". Several similarities and differences emerge among the users :
- All the users had an inactivity period on 13th march at 01 Am (61mn) except 2 users (4388161847 & 2891001357).
- 11 users (31.4%) have periods of inactivity beyond the 61 minutes on March 13th.
- Apart from the interruption on March 13th, the interruption periods mainly occur on Tuesdays and Sundays.
- The distribution of interruption periods is very random in terms of hours.
- 5 users out of the total population (14%) spent 50 hours or more not wearing the device (inactive).
- One of the users had a really abnormal behaviour and didnt wear the device for 224 hours (maybe he/she lost it and found it back)
Data Inconsistency : There should have been a recurrent inactivity period to charge the device for each user
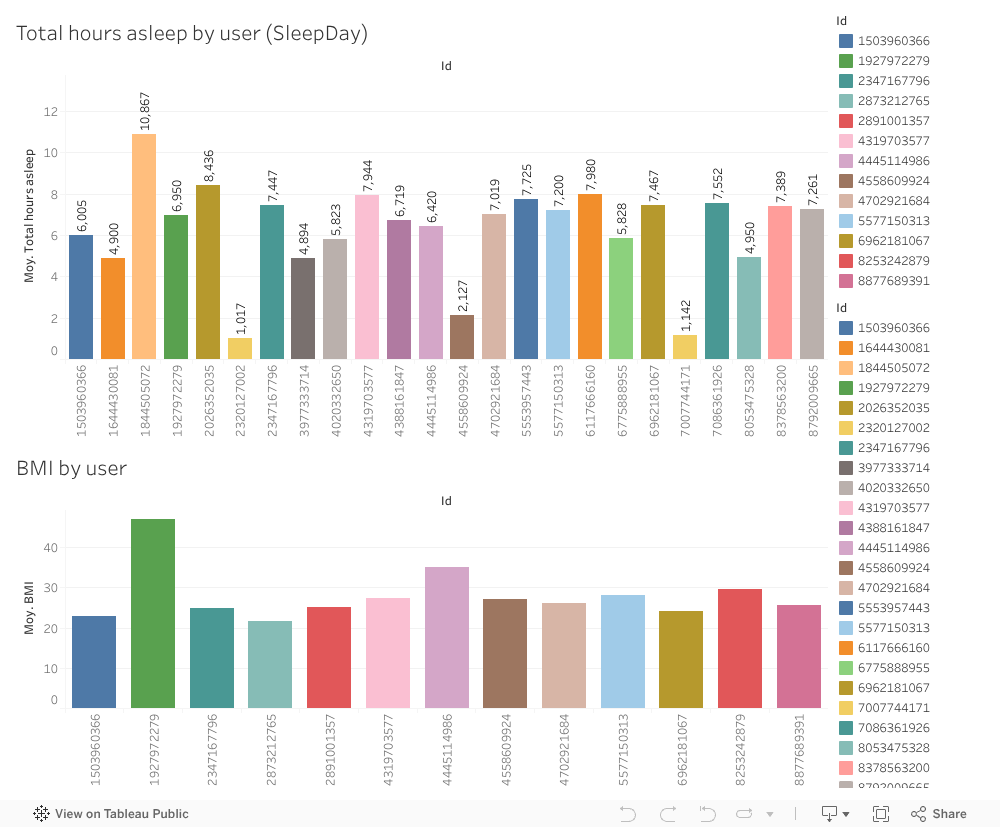
SLEEP ANALYSIS
This analysis represented a challenge as there is multiples sources of data for sleeping periods. First, we have to figure out which table we want to use : "Continuous_hours" or "SleepDay" ?
Continuous hours is a more complete table with more data so we'll start to analyse this table.
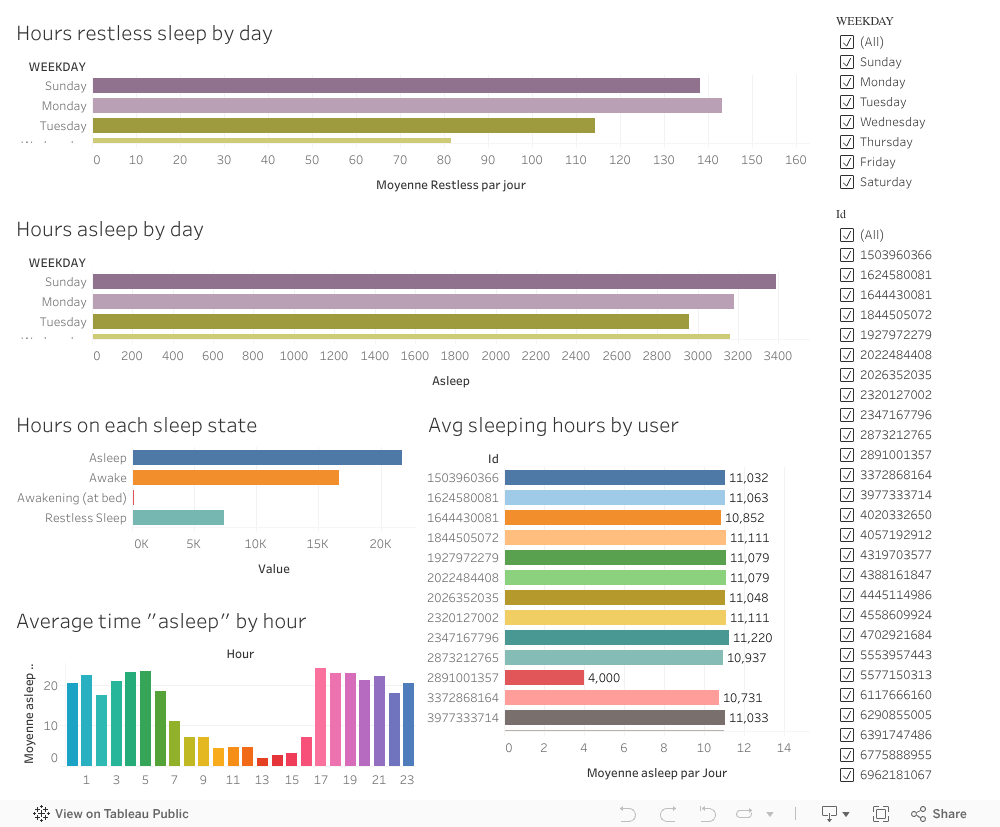
There are big Inconsistencies in the table "Continuous_hours".
First, according to the data, users appear to have spent more time asleep than awake, which does not align with normal human habits. The average sleep time per day and per user is around 10 hours/day. Additionally, the sleep hours are inconsistent, showing a peak at 5:00 PM for users. I have checked the data for duplicates or other issues, but nothing unusual was found. However, the results remain inconsistent. Ive lready noticed that there was a majority of "1" which means "Asleep" in the data which made no sense, at first, there was only 1 for Awake, 2 for restless Sleep and 3 Awakening. I added the 0 for "awake" thinking awake and Asleep would balance the sleeping patterns in my data but it remains inconsistent.
So We'll analyse "SleepDay" table instead :
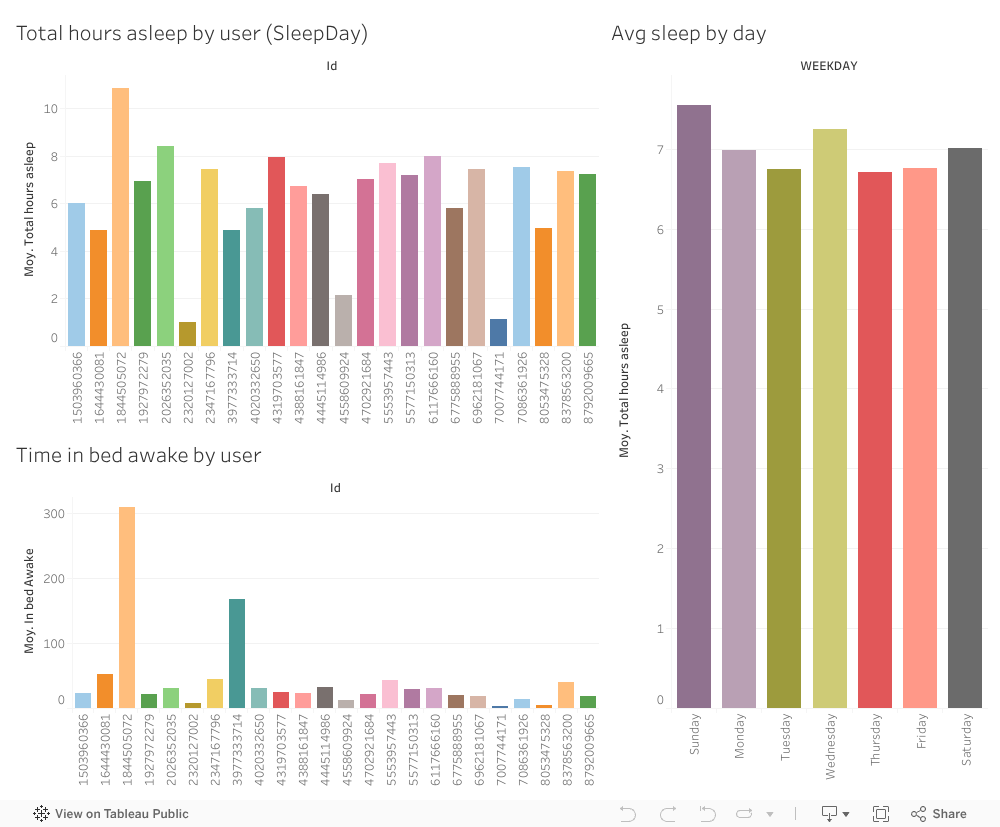
The data in the SleepDay table makes much more sense
- Only 24 users recorded their sleep in "SleepDay" table
- Among these 24 users, only 7 recorded their sleep More than 30 times (roughly each 2 days).
- 9 Out of 24 users (37.5%) recorded their sleep less than 10 times in 2 monthes
- Most users sleep around 7 hours per day.
- 4 out of 24 users (16%) have unusual sleep habits (either too much or too little sleep), but they are also the ones who recorded the least sleep data.
- 3 users out of the 24 (12%) sleep 2 hours or less by night on average
- On average, users spend 39 minutes awake while in bed
- 2 out of 24 users (8%) stay in bed for more than 2 hours per day. If these users are removed from the population, the average drops to 27 minutes per day
- On average, users sleep more on Sunday and less on thursday
CALORIES BURNT
The data from the "DailyActivity" and "Continuous_hours" tables show similar trends. Users who burn the most calories per hour (from "Continuous_hours") also tend to burn the most calories per day(from "DailyActivity"). The Weekdays count show differents trends but we will try to rationnally explain this difference.
Calories burnt from "Continuous_hours" :
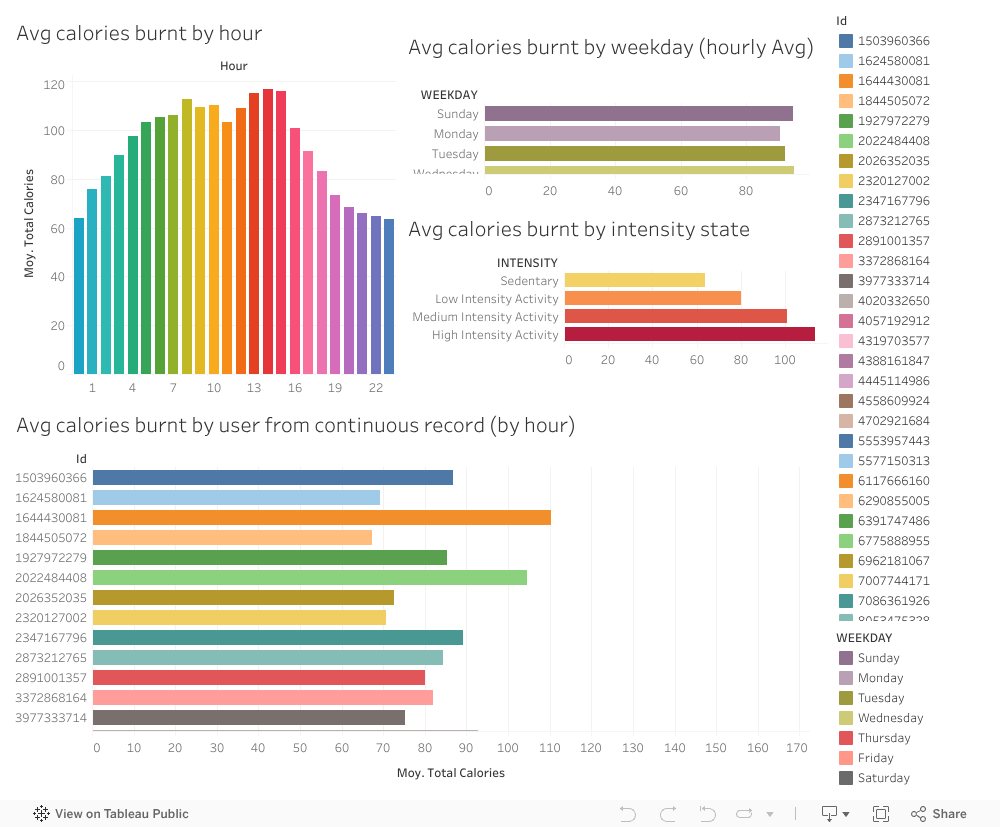
Calories burnt from "DailyActivity" :
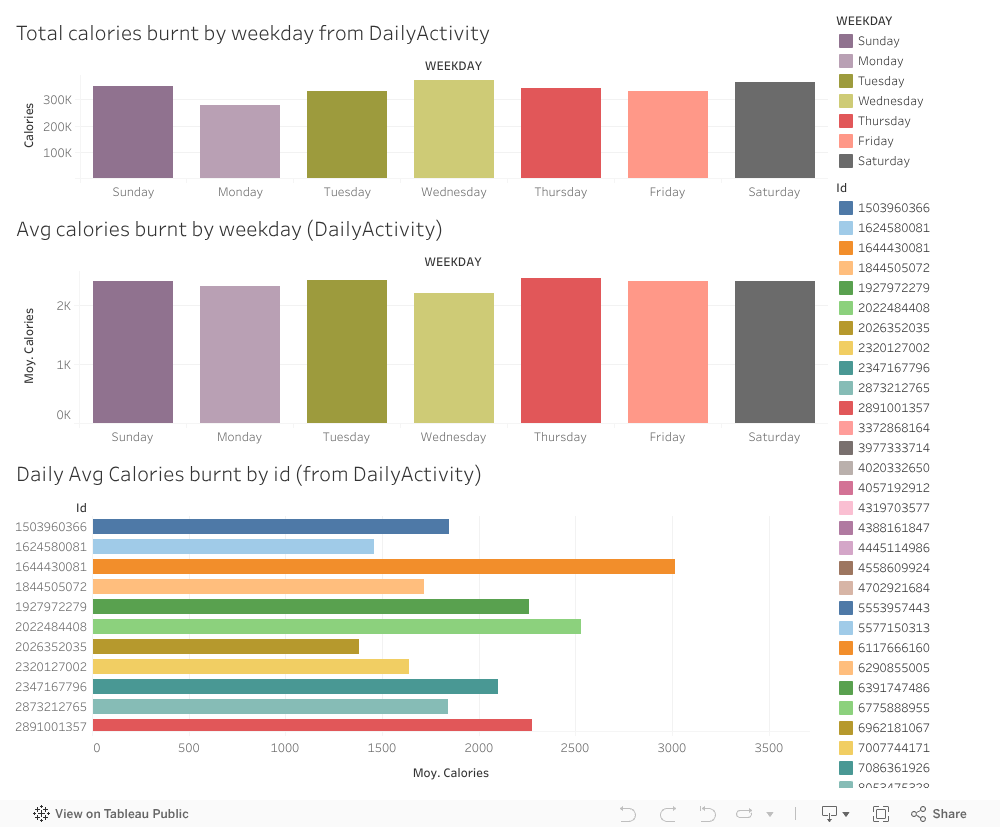
First, given the differences, it’s important to decide which variables (from “Continuous_hours” or “DailyActivity”) will be used to analyze calories burned by day of the week. In “DailyActivity,” the total number of calories burned is highest on Wednesdays. However, the average calories burned per day show that Sunday is the day users burn the most on average. If users log workouts through the app themselves for "DailyActivity", this could explain the difference. Wednesdays might be when users record the most activities, leading to higher average calories burned per hour in “Continuous_hours". We will focus on total calories burnt by day (from "DailyActivity") and average calories burnt by hour (from Continuous-hours) for this analysis.
Here is what data on calories tells us :
- Calories burnt on average : On average, Users burnt 2266 calories by day (DailyActivity) and 92.6 calories by hour (Continuous_hours)
- 14 out of the 35 users (40%) Burnt more than 2500 calories a day on average.
- 2 users out of the 35 (6%) Burnt less than 1500 calories a day.
- Calories burnt by day : On average, users burnt more calories per hour and logged more activities on Wednesdays, Tuesday, Saturdays, and Sundays.
- Calories burnt by day : Users tend to burn less calories on Mondays.
- Calories burnt by state of intensity : On average, Users burnt 113 calories while doing "High intensity activities", 101 calories while doing "Medium intensity activities", 80 calories while doing "Low intensity activities" & 64 calories while being "Sedentary"
- Calories burnt by hour : On average, users tend to burn more calories between 12 PM & 4PM
INTENSITY OF ACTIVITIES
This has been the trickiest part of the analysis considering that we have a lot of data that are not telling the same story in the differents tables, also, the results of this analysis needs to match the results of the "CALORIES BURNT" category to really make sense.
Intensities from "Continuous-hours".
Intensities from "Continuous-hours" : 2nd table.
Intensities from "DailyActivity".
Now I made a few Dashboards to show differences
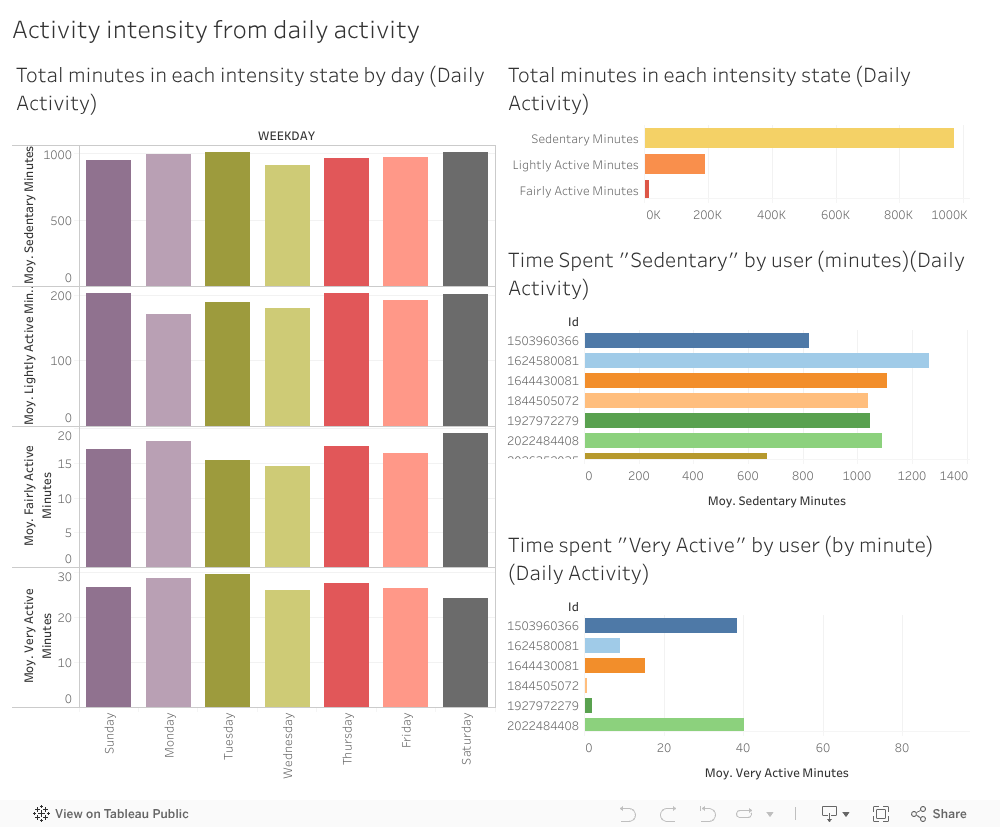
Differences : Time spent in the different intensity levels :
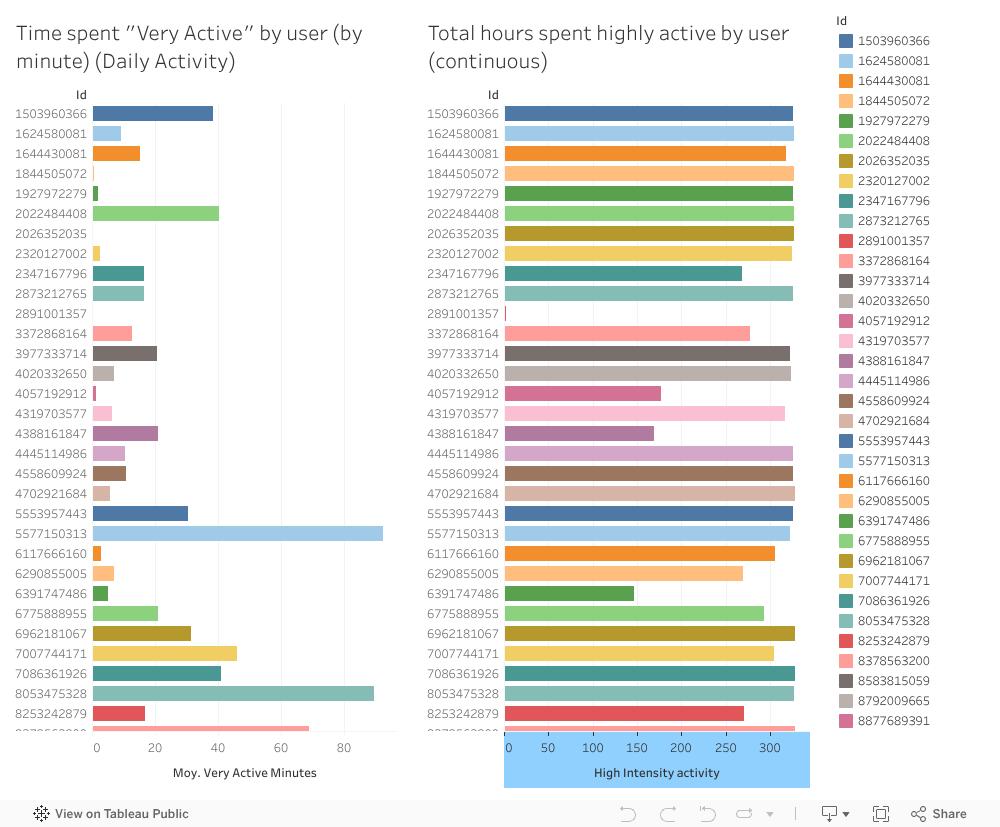
Differences : Time spent Very Active by user
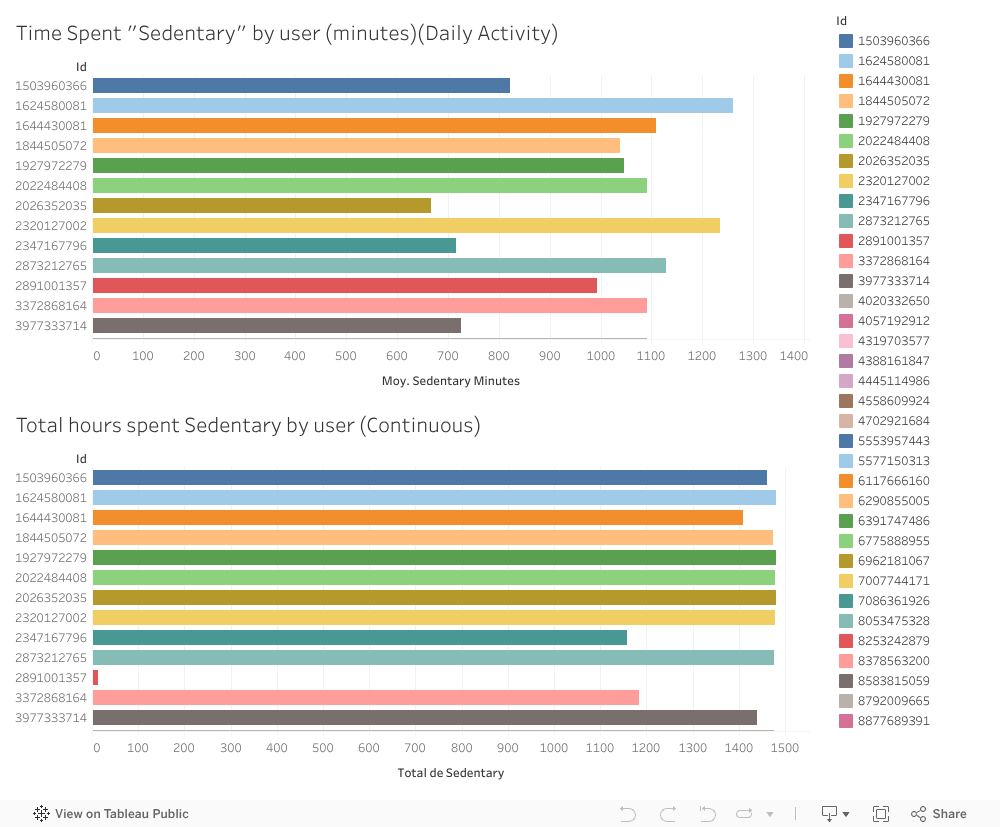
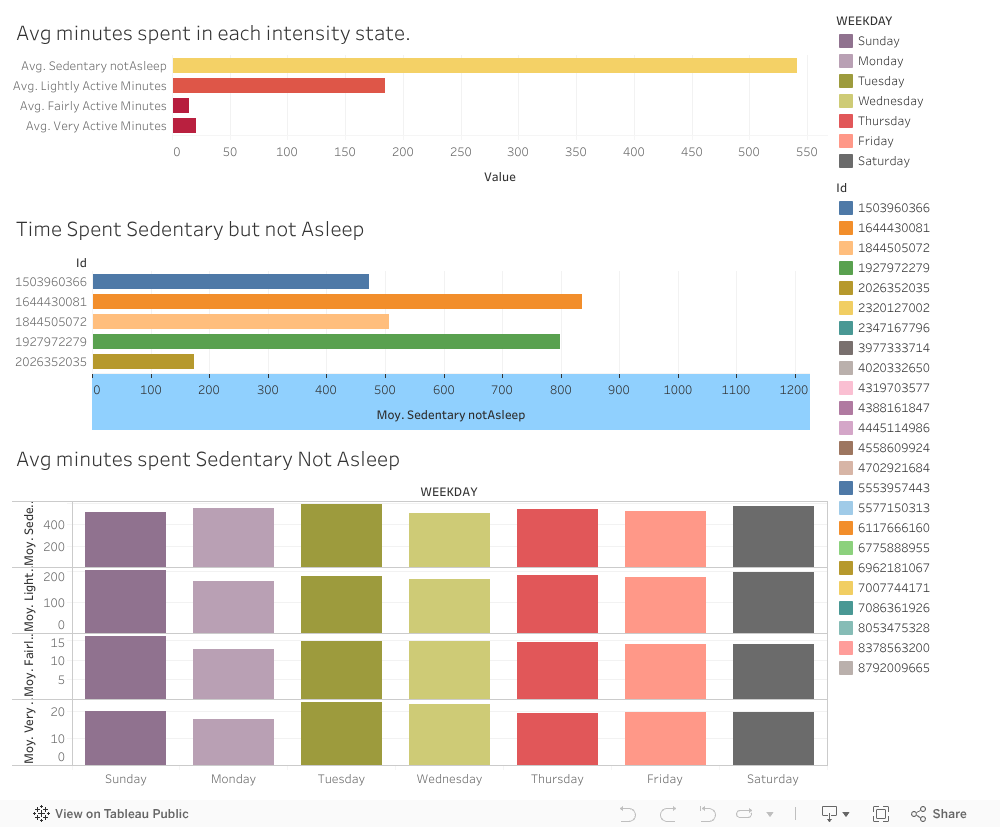
Differences : Time Spent Sedentary
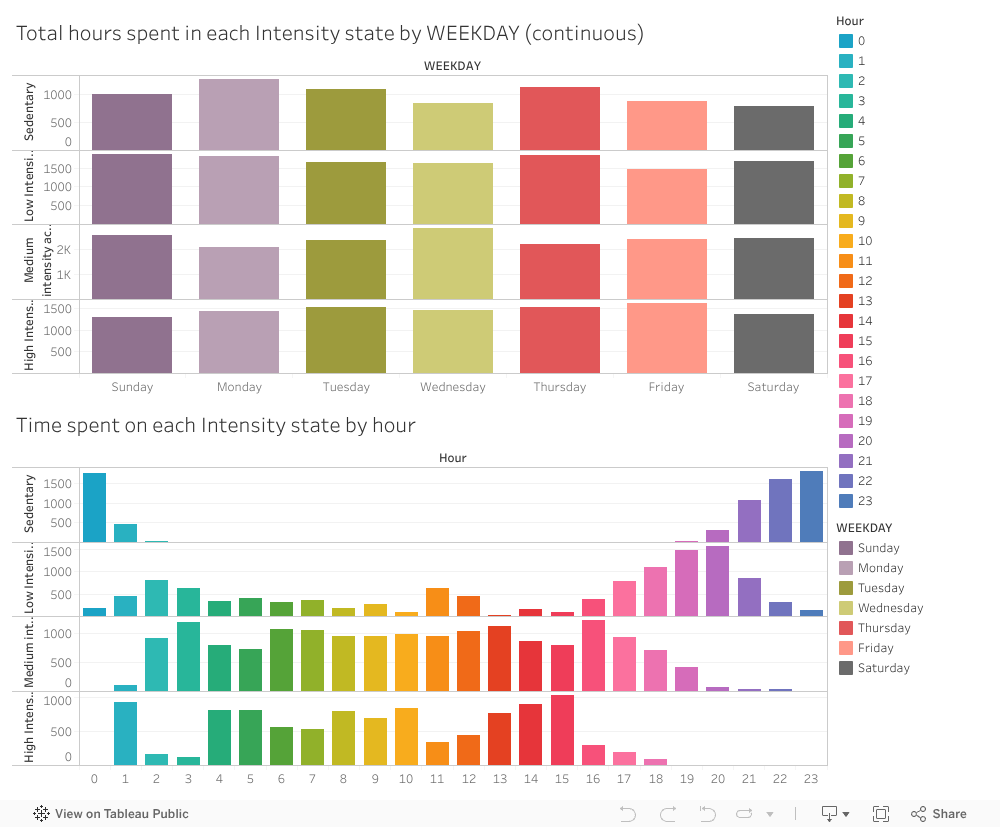
Differencies : Weekday
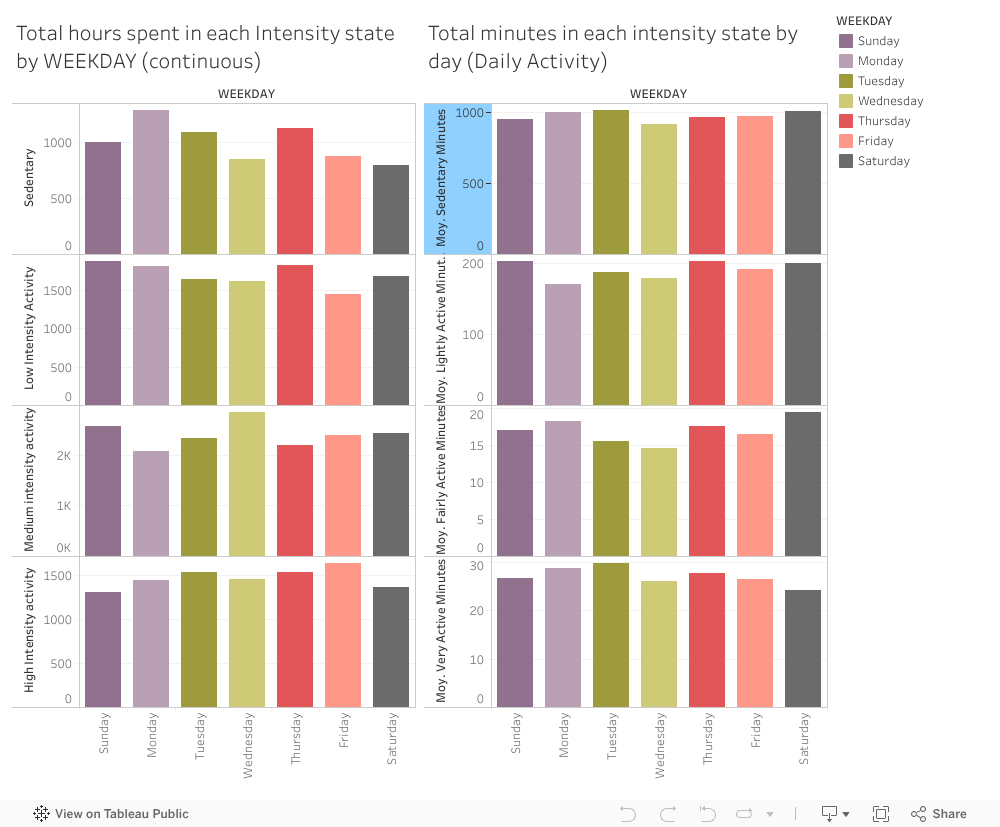
It seems like in DailyActivity each time there is a record, the record is also made during night (when people are asleep) so I ll try to explain the differencies in intensity levels using "Sedentary_NotAsleep" instead of "Sedentary"
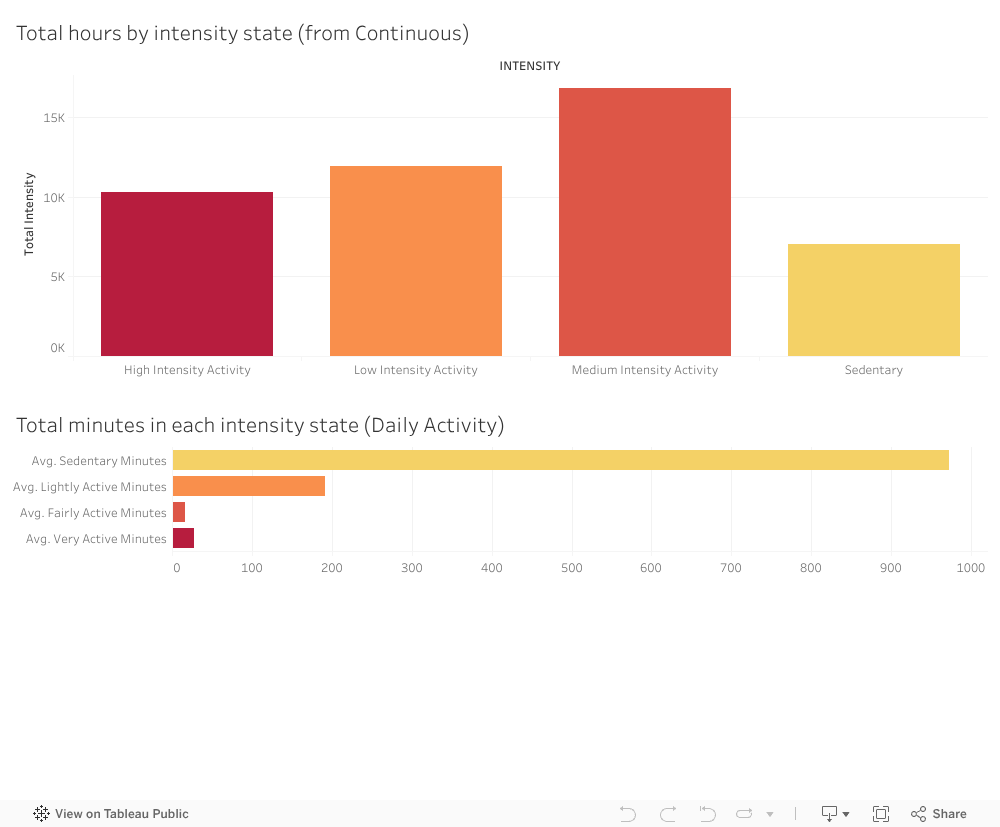
Intensities conclusions :
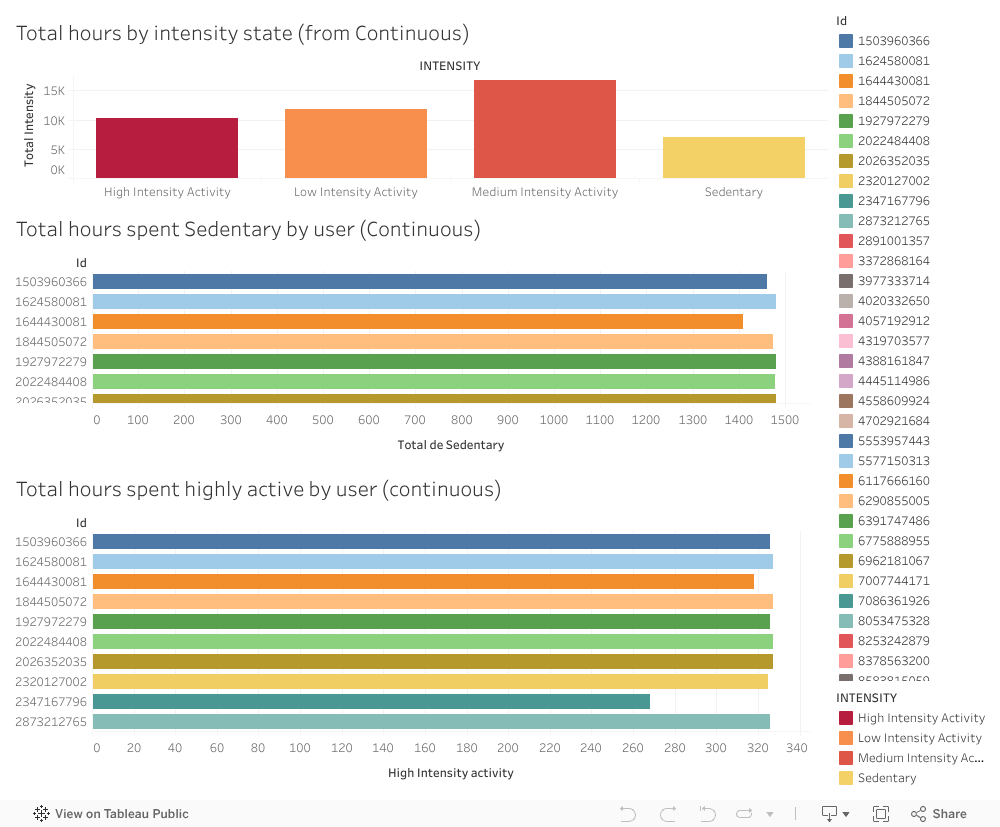
Inconsistencies in "Continuous_hours" :
Users spent more hours doing "high intensity and medium intensity" activities than being sedentary or in low intensity activities. As "Continuous_hours" is continuoulsy recording the data, it should show that users spent more time sedentary or in light intensity activities because of the sleeping periods.
Data shows that on average, users spent most of the high and medium intensity hours at night.
Users "Sedentary" and "Highly active" periods show too much similarities among users.
We have no choice but to focus our analysis on the "DailyActivity" table, here is what data tells us :
Most of the time a day is spent "Sedentary" : Users spent an average of 972 minutes (16h) being "Sedentary" and 541 minutes (9h) "Sedetary not Asleep".
7 out of the 35 total users (20%) spent more than 1200 minutes a day "Sedentary" (20%)
Users spent an average of 27 minutes a day "Very Active".
- Tuesday is the day most people are "Very Active" and also the day most people are Sedentary.
7 out of the 35 total users (20%) spent more than 40 minutes a day "Very Active"
Considering the inconsistencies in the "Continuous_hours" table, we won't use the table "high Intensity not recorded" to track high intensity activities not recorded in Daily-Activity. We can still use a query to check which users have a record in "DailyActivity" each time an high intensity level is recorded in "Continuous_hours" :
WITH AverageTimeInBed AS (
SELECT
    Id,
    AVG(TotalTimeInBed) AS AvgTimeInBed
FROM
    nimble-mode-447321-p1.bellabeat.SleepDay
GROUP BY
    Id
)
SELECT
    da.*, -- Sélectionne toutes les colonnes de DailyActivity
    COALESCE(atb.AvgTimeInBed, 0) AS AvgTimeInBed,
    da.SedentaryMinutes - COALESCE(atb.AvgTimeInBed, 0) AS Sedentary_notinbed
FROM
    nimble-mode-447321-p1.bellabeat.DailyActivity da
LEFT JOIN
    AverageTimeInBed atb
    ON da.Id = atb.Id;
Here are the users that have a record in "DailyActivity" each time they have an high intensity activity recorded in "Continuous_hours" :
4020332650
4057192912
4388161847
2891001357
There is 11% of diligent users that record their activity each time they do sport.
STEP COUNT ANALYSIS
There is a step count only in the table "DailyActivity" which makes the data source choice easier for this variable.

Here is what data tells us about users walking habits :
On average, users walked 7280 steps a day (5.20km).
9 out of the 35 total users (26%) Walked more than 10000 steps a day on average.
10 out of the 35 total users (28%) Walked less than 5000 steps a day on average.
On average, Users walk more on thursdays and less on wednesday.
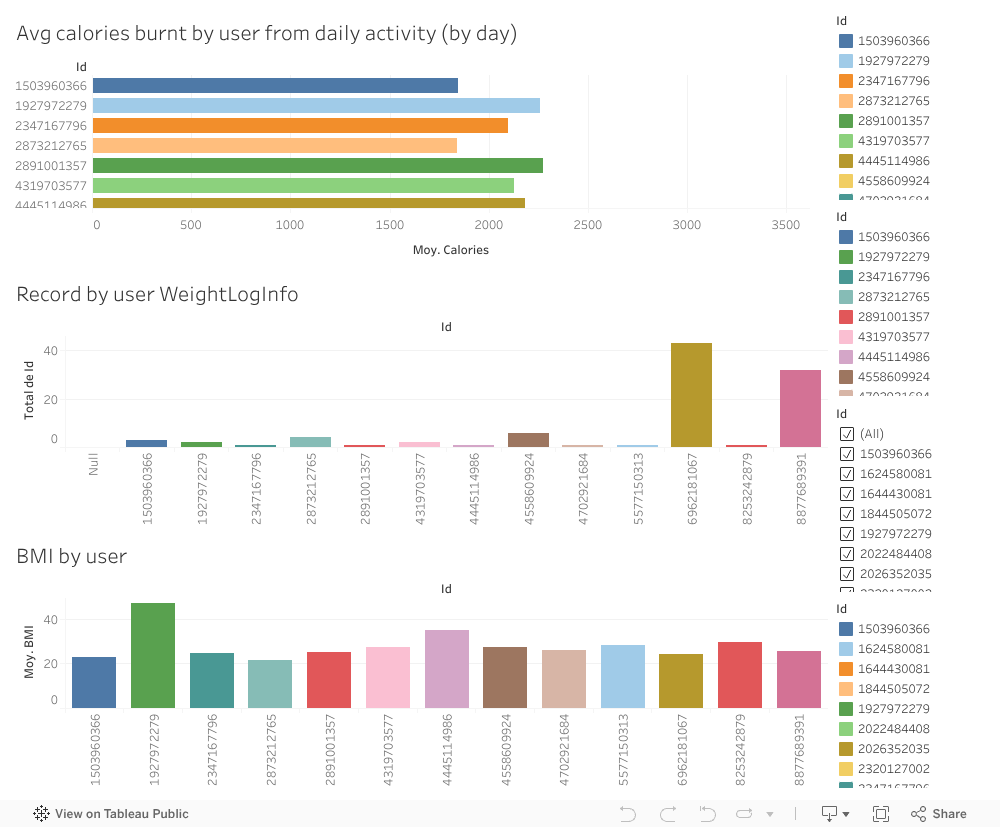
WEIGHT ANALYSIS
Table used here is "WeightLogInfo" (Reminder that this table counts only 13 users):
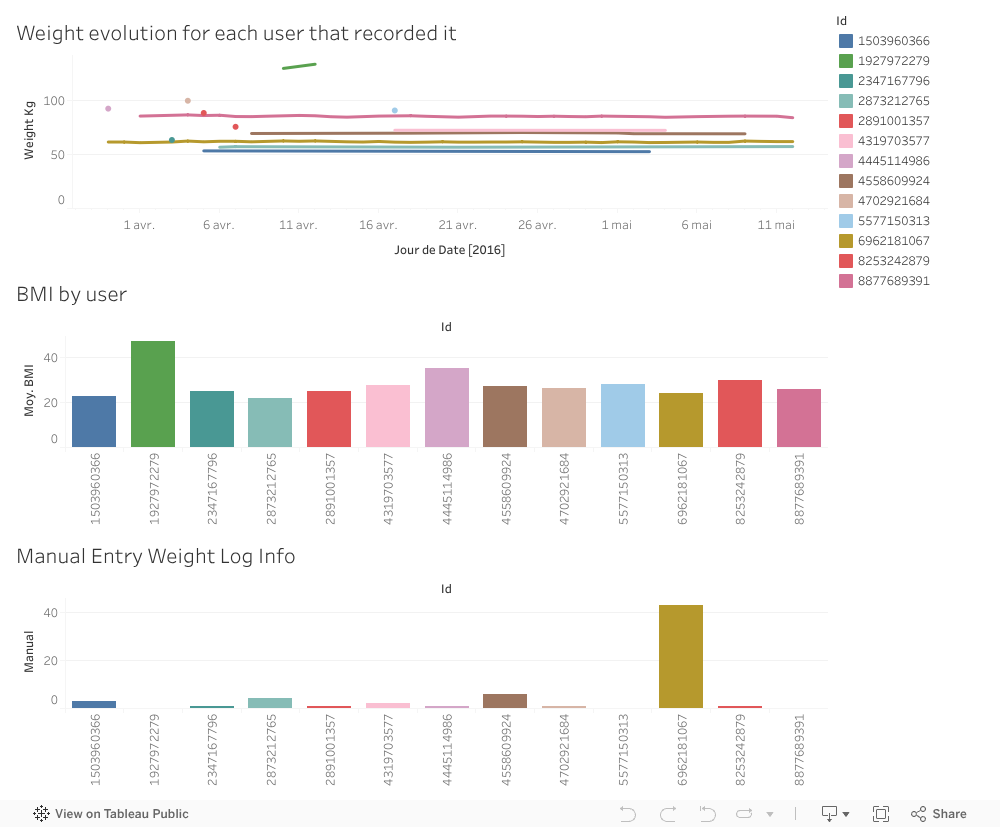
Here is what data tells us about users weight :
Weight variation : There is no big weight variation, most users remained at the same weight during the 2 monthes of the study. One of the users (8877689391) lost 1.5kg which is the biggest weight loss recorded these 2 monthes. Also one user (1927972279) which is also the heavier gained 4.5 kilograms in 2 days this is the most significant weight gain.
BMI analysis : no user is considered underweight (BMI under 19), 4 users (30%) are considered to have a "normal weight" (BMI between 19 and 25), 7 users (53%) are considered overweight (BMI between 25 and 30), 2 users (15%) are cinsidered obese (BMI over 30).
Manual entry : Most of the people have their weight data automatically tracked by the app. One user (6962181067) seem to track manually his/her weight data on a regular basis.
Weightlog info activity
We'll also analyse number of times users recorded their weight and when.
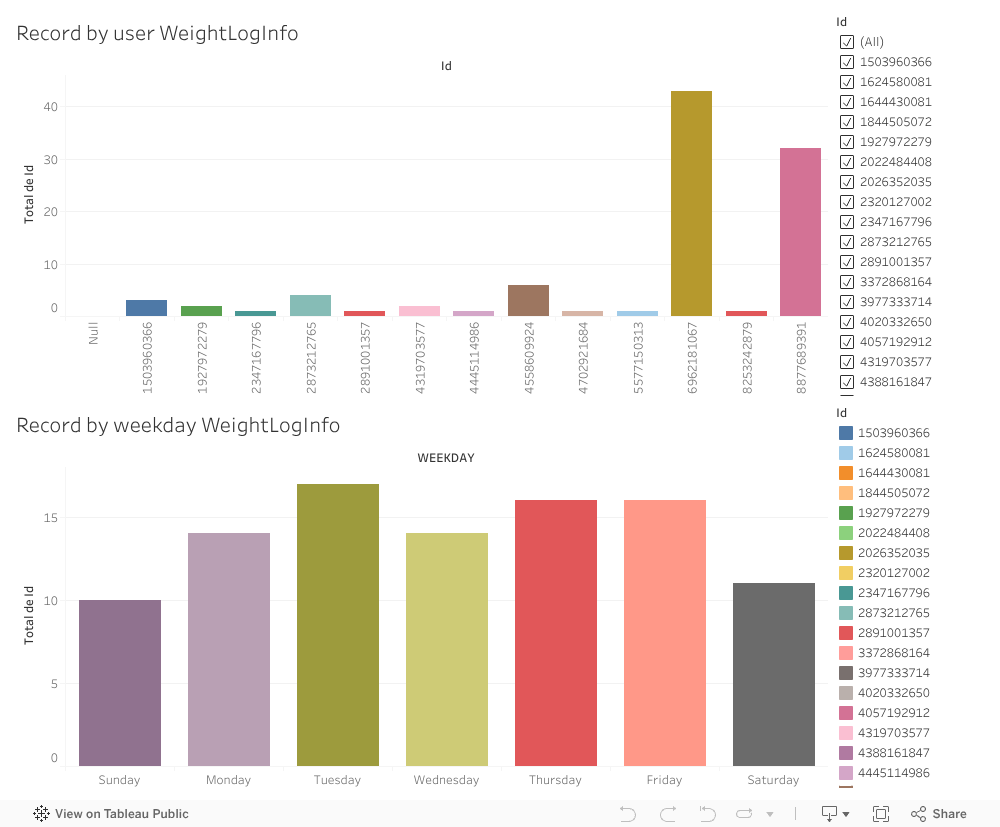
On average, users recorded their weight 7 times on 2 monthes by user. If we exclude users 6962181067 & 8877689391 that are the most consistent entering their weight data (respectively 43 & 32 times each), the average drops to 2 times on 2 monthes by user(roughly one time a month).
Day of the record : Most of the records are made on tuesday (17 times in 2 monthes) followed by thrusday and friday (16 times each), the main contributors record seem to record their weight everyday almost equally.
COMPARISONS
Calories burnt & Weight :
"Very Active" & Weight :
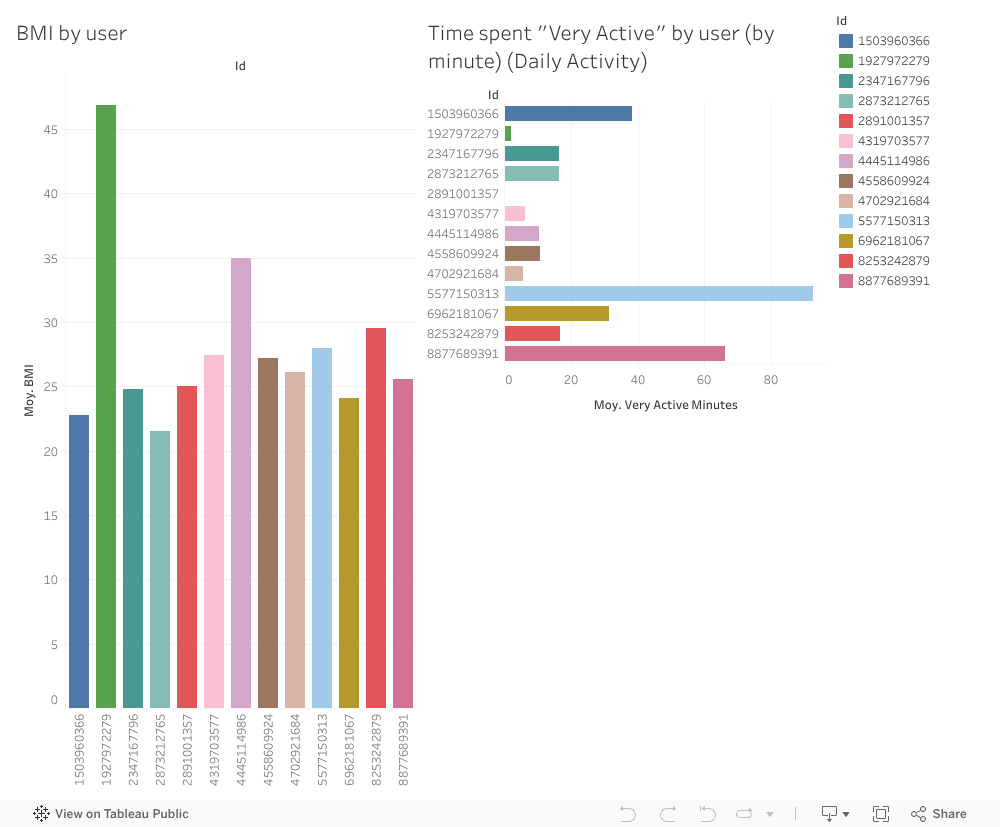
BMI / Activity : The user that spent the most time "VeryActive" is overweight (BMI = 28, 92 minutes a day "very active" on average). The 2 most overweight are not really active (less than 10 minutes a day on average). the most active are those who lose the most calories.
BMI / Activity Correlation : There is a light correltion between BMI and Activity. The more active people are, teh less BMI they have.
Activity / Weight record : The 2 users that record the most their weight are pretty active : (6962181067: 31 minutes a day, 8877689391: 66 minutes a day)
Steps & Weight :
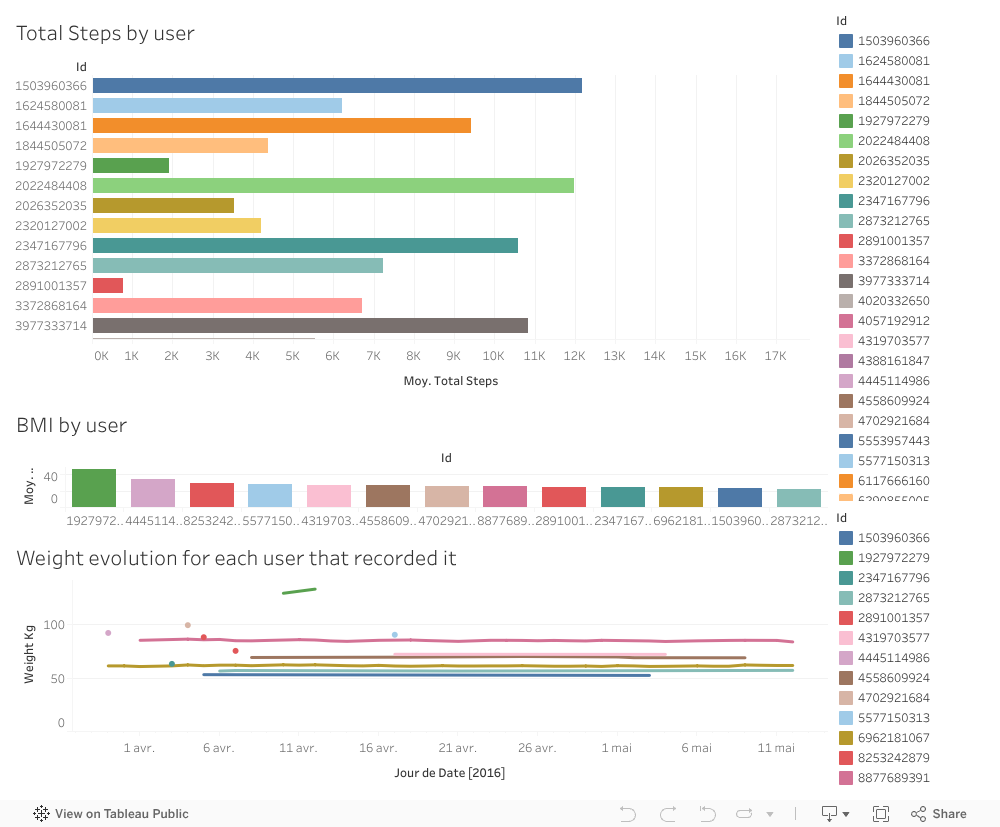
Steps / BMI : All the users that did more than 10 000 steps a day (4 out of the 13 users, 30%) are in good shape (BMI less than 25).
Steps / BMI : The 2 overweighted users walked less than 5000 a day
Steps / BMI Correlation : There is a strong correlation between the average of steps walked a day and the Body Mass Index. The more people walk the healthier they are (BMI under 25).
Sleep & Weight :
There is no correlation between Sleep and Weight or the correlation is not really significant.
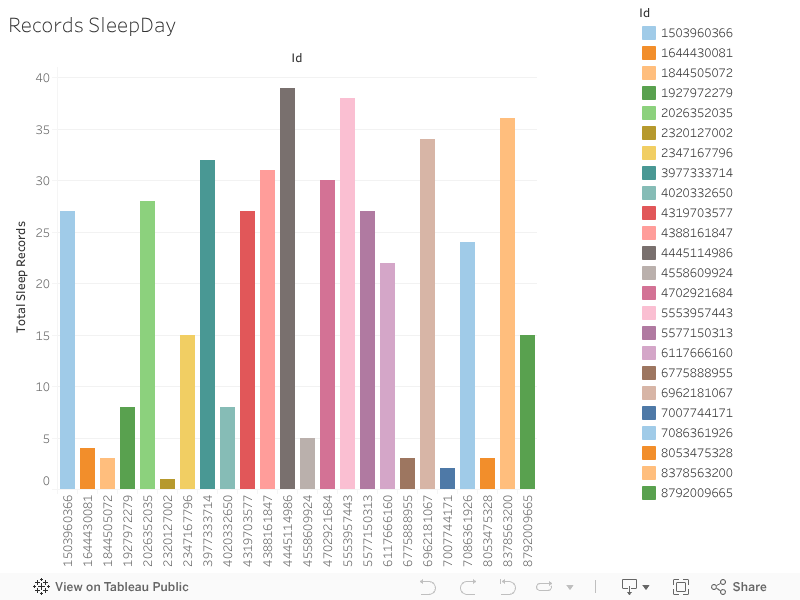
Records analysis :
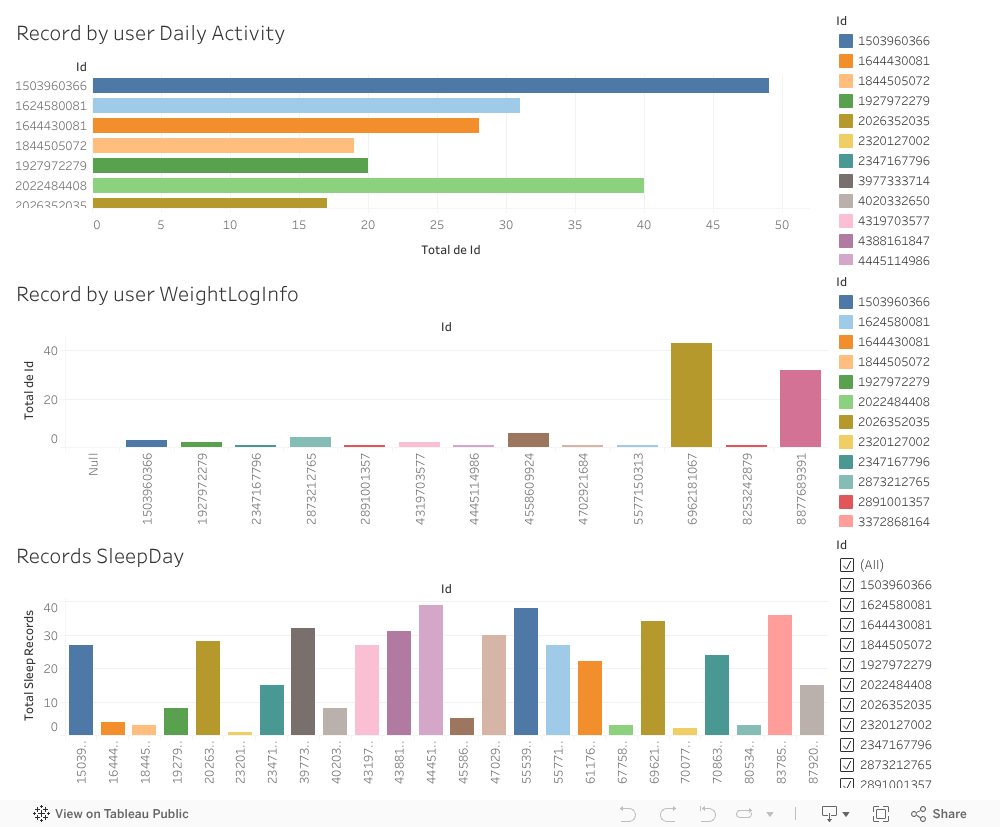
First, lets remember how many users there is in each table.
- Continuous_hours : 35 Users.
- DailyActivity : 35 Users.
- SleepDay : 24 users (68%).
- WeightLogInfo : 13 users (37%).
Now lets analyse recordings in these tables :
- 4 out of the 13 users from Weightloginfo didnt record their Sleep in Sleepday.
- 14 out of the 24 users from SleepDay didnt record their Weight in WeightLogInfo.
- 7 out of the total 35 users recorded neither their sleep nor their weight.
INTERPRETATIONS
INACTIVITY :
Inactivity period on march 13th at 01 Am might be a software update, some users might not have selected "auto update" in their preferences so they had no interuption for this period.
69 % of users wear their device all the time.
Inconsistency : No recurrent interruption for charging device.
SLEEP :
Only 24 users recorded their sleep in "SleepDay" table.
Among these 24 users, only 7 recorded their sleep More than 30 times" (roughly each 2 days). This shows that on average, users are not really diligent recording their sleep.
Most of the users have usual sleeping habits.
Inconsistency : Continuous_hours & Sleepday do not match.
CALORIES BURNT :
On average, Users burnt 2266 calories by day. According to Health Canada, a person might burn between 1,600 and 2,400 calories per day, with men typically burning slightly more than women. The results remains on the average but suggests that majority of users in this study might be mens (doesnt match Bellabeat needs).
Wednesday, Tuesday Saturday & Sunday are the days users burnt the most calories. But this could be related to a long workday. We need data about intensity of activities to really figure out which day is the day users prefer to do sports.
Most of the calories are burnt between 12 and 4PM. Which can fit with busniess hours (Then the most calories might be burnt during work not sport).
INTENSITY LEVELS :
On average, the users in this study spent 27 minutes "very active" (doing sport), 189 minutes a week (3.15 hours). Accoprding to most health guidelines, it is recommended to do between 2.5 and 5 hours of sport a week. This remains on the average but we could expect from fitbit users to be a bit higher than average.
Tuesday is the day where most people are "Very Active". This confirms our hypothesis from "calories burnt" interpretations category that users burnt more calories during long days of work (like wednesday) than during days with intense but short periods of sport (like tuesday).
Population is well distributed among intensity levels : there are as many mostly sportive people as mostly sedentary people (20% each).
On average, users spent 9 hours sedentary but not asleep. This might be improved spending less time sedentary.
STEP COUNT :
On average, users in this study walk 7280 steps a day. According to most health guidelines, adults should aim for 8000 to 10000 steps a day to remain healthy. Walking might be neglected in many cases, users might think that sport is enough to remain in good shape, but good walking habits seem to be a key factor too.
28% of the users walked less than 5000 steps a day on average. This might be improved encouraging people to walk more.
WEIGHT :
On the 13 users of Weight table, only 2 recorded their weight more than 10 times. This shows that users are even less diligent recording their weight than their sleep.
Most of the users in this study are overweight, maybe most of the users that are worried about their weight are overweight (and choose to track it on the app) other people might not be willing to track their weight because they are not worried about it.
Most of the users track their weight on tuesday, which fits to the day users do more sport.
All the people that walked more than 10000 steps have a Body Mass Index under 25 which means walking is very important to remain healthy.
Sport is also a key factor to remain in good shape.
RECORDS :
For 4 people out of the total, it is more important to track weight than sleep (11%).
For 14 people out of the total, it is more important to track sleep than weight (40%).
For 7 people out of the total, it is not important to record more than sport data (20%).
RECOMMANDATIONS
It is important to remind that this dataset didn't passed our ROCCC test, the recommandations i will make here are based on this unreliable dataset. In my point of view this case study is not really about the outcome (making a real data based strategy for Bellabeat), but more a way to show our analytical thinking process. We will still make recommandation based on this dataset but it is risky to use them in a real life scenario. I tried to explore all the data that was available in this dataset trying to make sense out of it. I might have lost a bit of time analysing "Continuous_hours" but in my point of view i had to check for inconsistencies to make sure i wont use this data. This was also an interesting study to spot inconsistencies in data. I wasn't expecting a dataset from Google analytics to be so messy at the beginning. It have been a bit frustrating but i think that being able to spot inconsistency are even more important in data analysis than the analysis itself (because if analysis is made with unreliable data and that a strategy is based on this analysis, it can lead to huge loss for a company.) In a real life scenario i would have asked my supervisor for budget to acces more data, I would have pushed my analysis further asking "why" to each result and maybe use some more quantitative analysis tools.
INACTIVITY :
Enhancing quality : Conduct a quality analysis on continuous records to check if everything works well and find why charging time doesnt appear.
Push the analysis further : To better know about reasons why users remove their device several actions can be considered : Make a classic survey adressed to the users or add a function on the app that asks why the user removes his/her device once device tracks interruption.
Enhancing quality : If it is not already the case, add geolocalisation to devices even when they have no battery to avoid loss.
Encourage users to wear device : Alert on the app when device is ready to use but not worn.
SLEEP :
- Enhancing quality : First, it seems essential to make sure automatic record of the sleeping periods works well. We must assume user lazyness and minimize reliance on their personal engagement to collect sleep data.
Enhancing sleeping habits : Notifications throught the app to warn users with bad sleeping habits. Sensibilisation on good sleeping habits benefits.
Push the analysis further : Send a quick survey to customer on their sleep when device track they woke up. Asking them how they would rate their night, if they feel they had enough sleep or if they feel well-rested.
CALORIES :
Encouraging users to burn more calories : Notifications throught the app to warn users that burnt less calories than average.
INTENSITY :
Enhancing quality : Same as sleeping records everything must be quality checked to make sure recording of intensity works well.
Make sure users track their high intensity activities : Notification on the device asking if user want to record his activity when high intensity activity is tracked.
Enhancing habits : Warn users throught the app when they spend too much time sedentary for several days.
STEPS :
Enhancing quality : Recording of steps must be automatized without needing action from user.
Enhancing habits : Make a sensibilisation campain on the app on good walkings habits benefits.
Enhancing habits : Alert when users dont walk enough for several days.
Enhancing habits : Track if user is driving and suggest going too work another way if their drive to work too much.
WEIGHT :
Enhancing quality : Suggest exercices on the app to encourage weight loss.
Enhancing quality : See if there are way to track BMI or other health related metrics automatically.
Enhancing quality : To encourage people record their weight, send notification after a period of sport(people might be at the gym and have acces to a scale).
Enhancing habits : Remind people that they shouldnt wait to be overweight to track their weight.